Surging stock markets since the lows of March 2009 have caught most investors by surprise, especially as new pieces of the economics puzzle are not always rosy and do not quite seem to support an overly bullish case. In short, investors are increasingly struggling to make sense of the most likely direction of stock prices.
Are we perhaps nearing the end of a cyclical bull phase in a structural bull market? Or will strong earnings growth ensure the longevity of the bull? Or is a "muddle-through" trading range in store? It seems to be a case of so many pundits, so many views.
It is one thing to trade the market's rallies and corrections, but this is easier said than done, with not many people actually getting it right with any degree of consistency. Others are of the opinion that the recipe for creating wealth is simply to follow the patient approach, saying that "it's time in the market, not timing the market" that counts. But "buy-and-hold" investors in the S&P 500 Index are still 25.5% down from the levels of 10 years ago, the Dow Jones Industrial Index a similar 23.5% lower and the Nasdaq Composite Index a massive 52.5% under water.
This gives rise to the all-important question: does one's entry level into the market, i.e. the valuation of the market at the time of investing, make a significant difference to subsequent investment returns?
In an attempt to cast light on this issue, my colleagues at Plexus Asset Management have updated a previous multi-year comparison of the price-earnings (PE) ratios of the S&P 500 Index (as a measure of stock valuations) and the forward real returns (considering total returns, i.e. capital movements plus dividends). The study covered the period from 1871 to March 2010 and used the S&P 500 (and its predecessors prior to 1957). In essence, PEs based on rolling average ten-year earnings were calculated and used together with ten-year forward real returns.
In the first analysis the PEs and the corresponding ten-year forward real returns were grouped in five quintiles (i.e. 20% intervals) (Diagram A.1).

The cheapest quintile had an average PE of 7.7 with an average ten-year forward real return of 11.4% per annum, whereas the most expensive quintile had an average PE of 23.4 with an average ten-year forward real return of only 3.8% per annum.
This analysis clearly shows the strong long-term relationship between real returns and the level of valuation at which the investment was made.
The study was then repeated with the PEs divided into smaller groups, i.e. deciles or 10% intervals (see Diagrams A.2 and A.3).


A third observation from this analysis is that the ten-year forward real returns of investments made at PEs between 12 and 17 had the biggest spread between minimum and maximum returns and were therefore more volatile and less predictable.
As a further refinement, holding periods of one, three, five and 20 years were also analyzed. The research results (not reported in this article) for the one-year period showed a poor relationship with expected returns, but the findings for all the other periods were consistent with the findings for the ten-year periods.
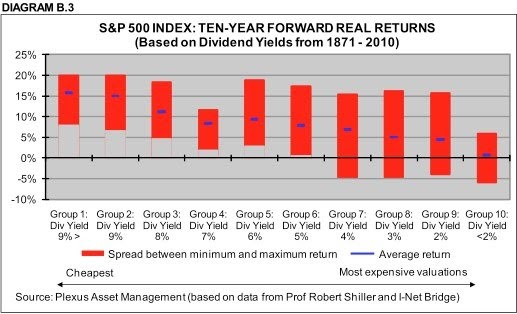
Although the above analysis represents an update to and extension of an earlier study by Jeremy Grantham's GMO, it was also considered appropriate to replicate the study using dividend yields rather than PEs as valuation yardstick. The results are reported in Diagrams B.1, B.2 and B.3 and, as can be expected, are very similar to those based on PEs.


Although the research results offer no guidance as to calling market tops and bottoms, they do indicate that it would not be consistent with the findings to bank on above-average returns based on the current ten-year normalized valuation levels. As a matter of fact, there is a distinct possibility of some negative returns off current price levels.
No comments:
Post a Comment